GCP Goodies Part 9 — Time series data handling and visualization
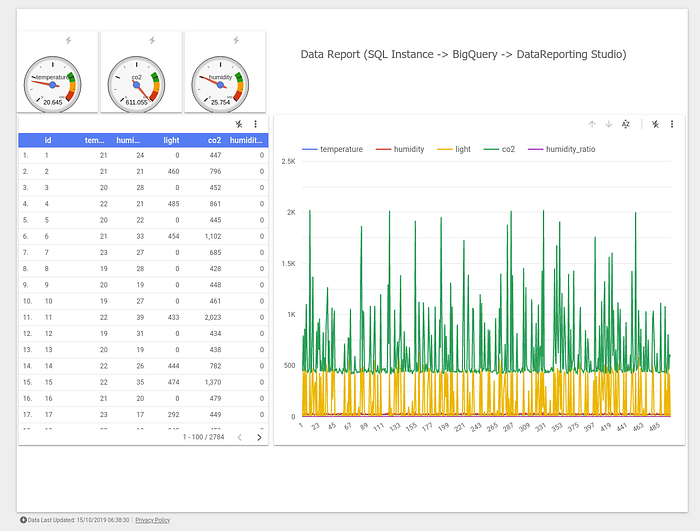
This time we are going to utilize a couple of GCP services to display a report. The whole point of this tutorial is to use BigQuery with DataStudio but to make things a little bit more interesting and challenging at the same time we are going to push the data continuously to the database using simple web application.
Setup Overview

The report itself will be build with Google Data Studio but the data for the report will travel from the CSV file read at random positions by the web application on Kubernetes cluster. The web application will push the data to MySQL database and that data will be available to BigQuery. Data read by BigQuery will become the source of truth for the report. Throughout this tutorial you will be able to see how easy it is to create this flow and how powerful DataStudio with BigQuery can become.
Creating GCP Infrastructure
As usual, we are going to create a Kubernetes cluster where we deploy our web application. The sources for the application which you can build and deploy are available as part of the whole GCP Goodies series here.
Open up a console and navigate to part-9 directory. We need to set some variables first, like the name of the cluster to be created or the zone where we want to create it.
Important note: Select your zone wisely, as for the cluster itself it’s not of much importance the zone in which our SQL Instance will operate; it’s very important as for some of them its not possible to use BigQuery federated queries. In other words, creating SQL Instance in wrong zone can result in inability to use BigQuery with it.
NAME=stackdriver-test-9
ZONE=us-west2-a
gcloud auth login
gcloud config set compute/zone $ZONE
gcloud config set project softwaremill-playground-2
Create a 2-node cluster:
gcloud container clusters create $NAME --num-nodes=2 --scopes=https://www.googleapis.com/auth/cloud-platformNow it’s time to create our SQL instance. Navigate to Storage -> SQL and select Create Instance
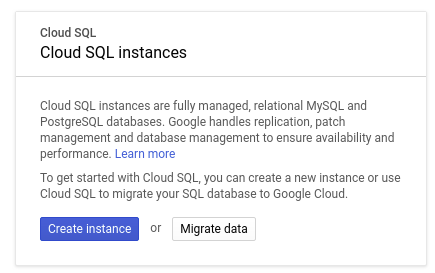
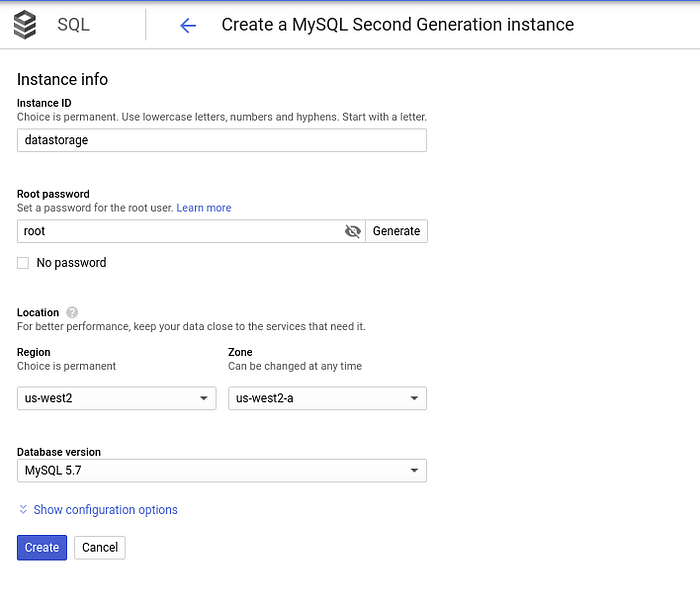
Set up the details like name, instance type, region and leave the rest with defaults. Make sure that the region you choose is allowed in BigQuery CloudSQL Federated Query mechanism as mentioned earlier. Cloud SQL is supported in all BigQuery regions: https://cloud.google.com/bigquery/docs/locations.
It would be best if you choose the same region/zone as you have chosen for the cluster in the previous step.
Once the instance gets created, click on its name and navigate to the Users tab to create a new user:
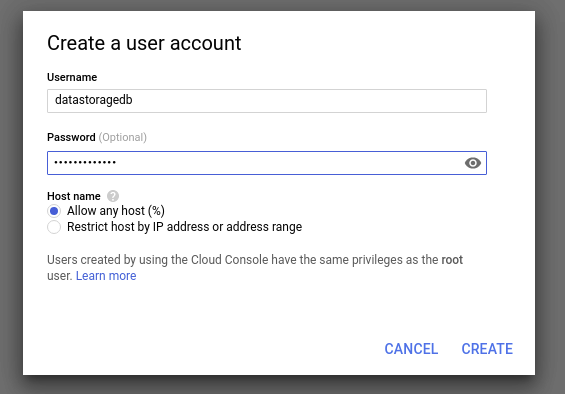
Write down the Username and Password, we will need that for later when creating secrets on Kubernetes cluster.
The next step would be to create the database itself, navigate to Databases tab and click Create Database button:
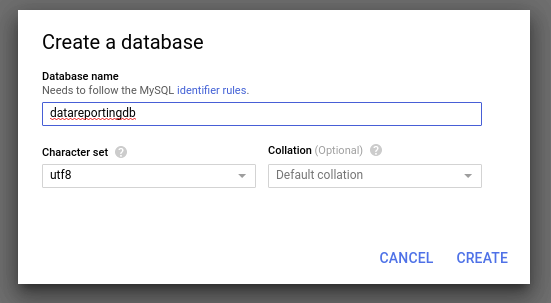
Now we need to create a service account which we will use to connect from our pod on GKE to SQL Instance.
Navigate to APIs & Services -> Credentials and click on Create Credentials -> Service Account Key
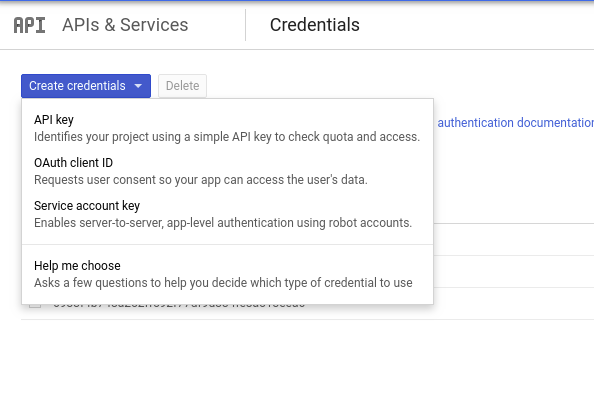
Select New Service Account, add name and select role to be Cloud SQL Client or Cloud SQL Admin. Click Create to download the credentials json file.
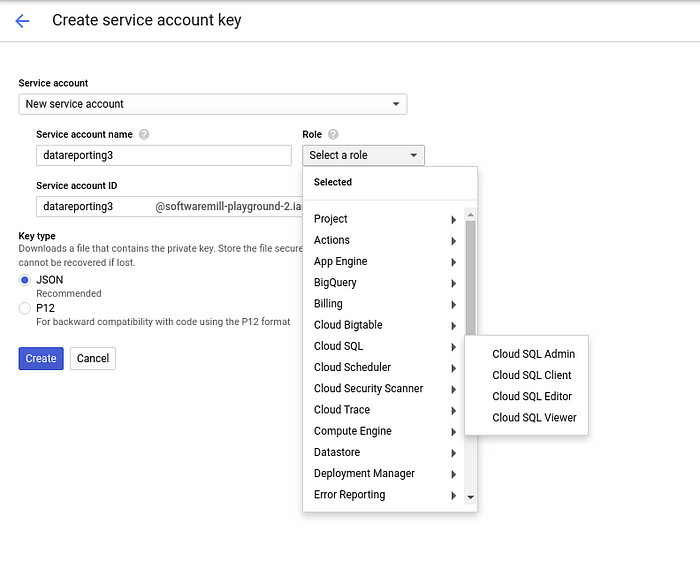
Data set
To make things a little bit easier on the web application side we are going to use already available time series data set. This will allow us to build graphs from data which makes some sense and it’s not completely randomly generated. Our data set is called Occupancy Detection Dataset and it describes measurements of a room. Used with machine learning models the objective is to predict whether or not the room is occupied.
There are 20,560 one-minute observations taken over the period of a few weeks. There are attributes like temperature, light, co2, humidity etc.
The source for the data is credited to Luis Candanedo from UMONS.
In our web application, the scheduler pings an Akka actor to push a randomly picked row from this data set to the database:
This way, when creating the report we can use Refresh functionality to see how the data changes over time while building the report.
Download the data set and extract it to some location on your local machine. We will need to push it later to our Kubernetes cluster for use by the web application.
Releasing the application
At this point you should have Kubernetes cluster and Cloud SQL Instance running, database and database user created, google credentials file for Cloud SQL and data set downloaded. It’s time to play with kubectl command.
gcloud compute instances list
gcloud container clusters get-credentials $NAME
kubectl get po
For our Kubernetes pod to be able to connect to Cloud SQL instance we need to create two separate secrets, one holding the credentials to the database and one storing the credentials.json file for our service account.
Create a file with the following content (changing the values to the ones you have used when creating the user and the database earlier)
username=some_username
password=some_password
(there is a file called credentials.txt inside the conf directory of the part-9 project)
Create secrets on the cluster itself:
kubectl create secret generic cloudsql-instance-credentials --from-file=credentials.json=/path/to/your/credentials.jsonkubectl create secret generic cloudsql-db-credentials --from-env-file ./conf/credentials.txt
Get the database connection string:
gcloud beta sql instances describe datareporting | grep connectionand change kubernetes-manifest.yaml under command section, e.g:
command: ["/cloud_sql_proxy",
          "-instances=softwaremill-playground-2:us-west1:datastorage=tcp:3306",
Create config map to store our data read by the web application every second at random position and insert it into the database:
kubectl create configmap config --from-file /path/to/your/datatraining.txtLast, change the database name in application.conf to the one you have created earlier.
Build the application with sbt clean release and note the version generated. Use that version to change value in kubernetes-manifest.yaml under theimage path property.
Release the app:
kubectl create -f conf/kubernetes-manifest.yaml
Querying data with BigQuery
Now the fun part begins. We are going to connect BigQuery with our Cloud SQL Instance. To do that we will use Federated Query functionality of BigQuery to run queries against our sql instance.
Navigate to Big Data -> Big Query and then ADD DATA and Create Connection.

We are going to use Cloud SQL Federated Queries to play with our data set.
Fill up the connection details:
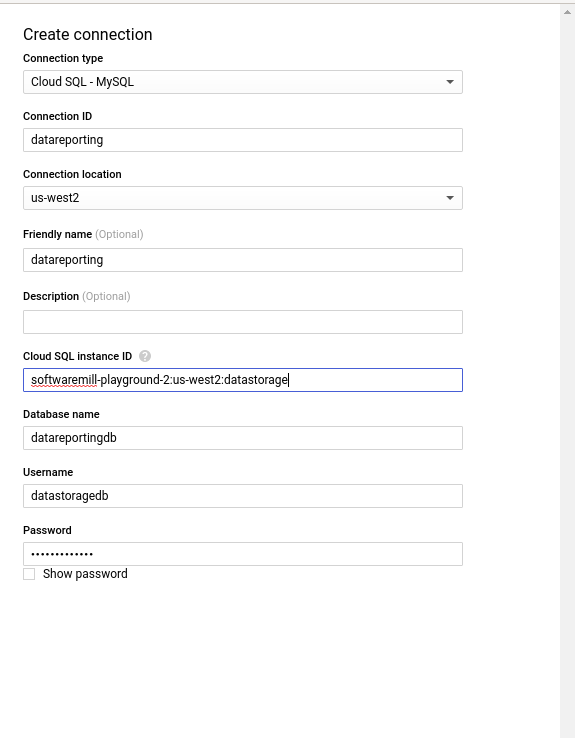
The instance id will be the same as the one used in kubernetes-manifest file.
Select your external connection, click Query Connection button and example BigQuery sql will be populated for you, click Run
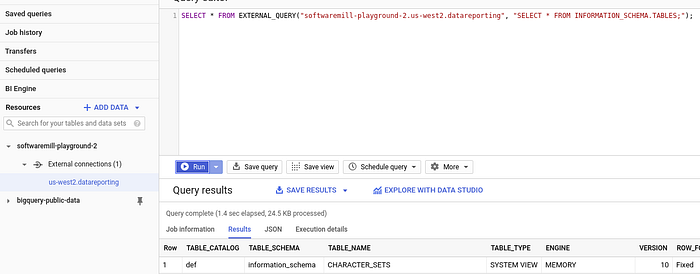
You can query all the records stored so far in roomdata table with simple:
SELECT * FROM EXTERNAL_QUERY(“softwaremill-playground-2.us-west2.datareporting”, “SELECT * FROM roomdata;”);You should see the records available in BigQuery query results pane:
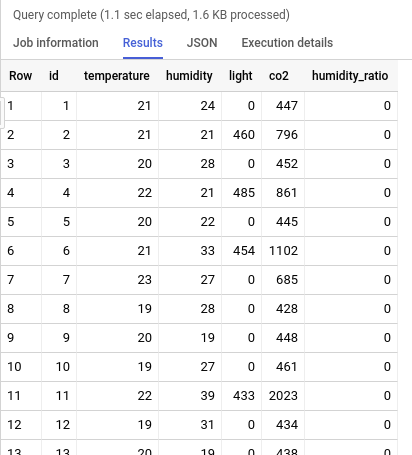
Now we can start creating our first report, click Explore with Data Studio button and start adding charts:

First chart will be simple line graph, pick it up from Add a chart drop down and set the dimensions like the ones below:
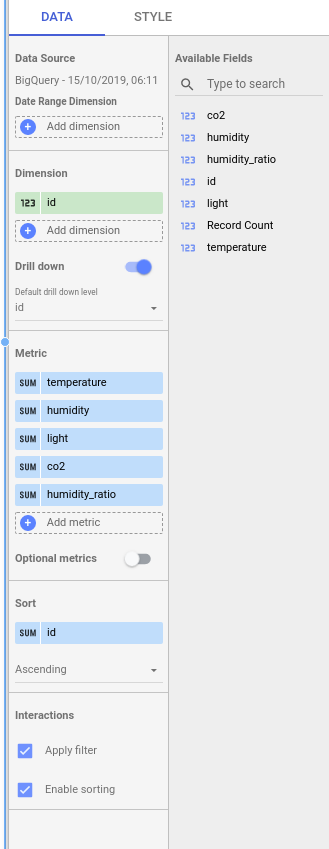
You should see lines for each metric being added to the graph as you follow along adding the metrics.
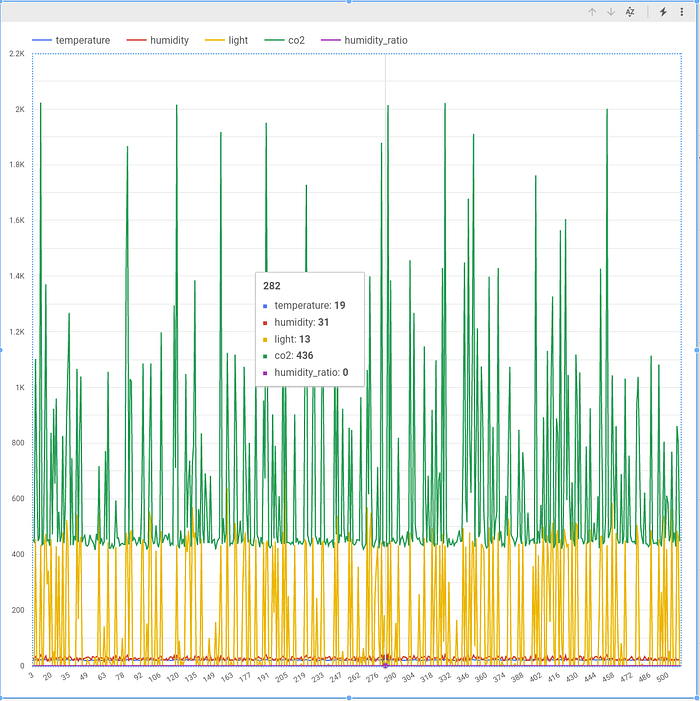
There is a ton of functionalities coming out of the box in graphs built with data studio, you can zoom on the data range, select specific metrics you want to see and many more. Play around it to see how cool the data studio charts can be.
The next kind of an item we are going to add are Gauges, Gauge is a community widget so you select it using the drop down with boxes icon on the right of the Add a chart selection, pick one, change its size on the dashboard and set the dimensions as follows:
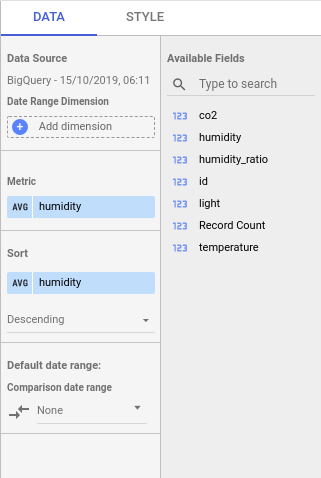
Just to make things a little more interesting, the last item we are going to add will be table, pick one from the Add a chart drop down selection and fill the metrics and dimensions as follows:
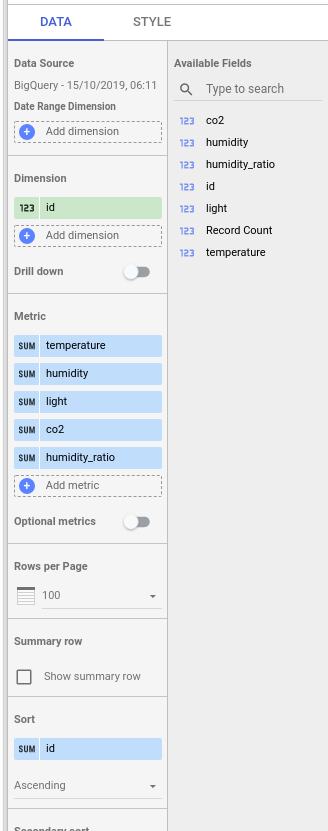
You can set the number of rows per page, create summary row, sort the data etc.
Final version of our Data Studio report looks like the following:
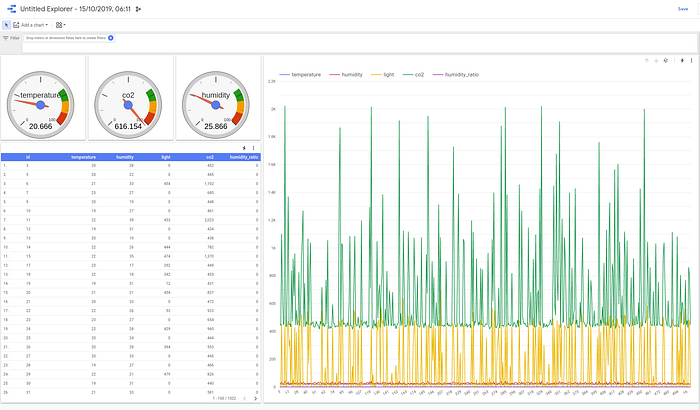
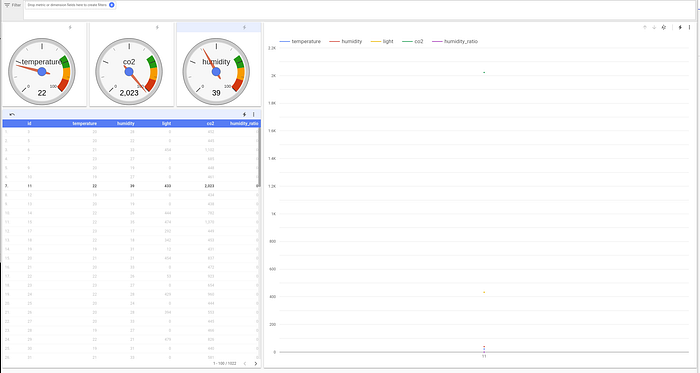
What’s interesting is that selecting single value in chart causes the rest of the widgets to display only that value:
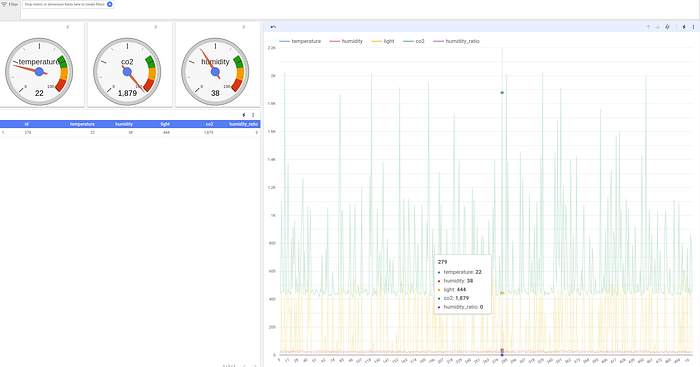
Similarly, selecting single point in our table causes single point display on our chart and gauges:
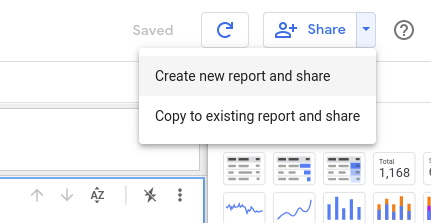
Once you are happy with what you’ve got on the dashboard you can create report out of Data Studio and share it:
Creating report functionality allows you to add some additional text and other widgets:
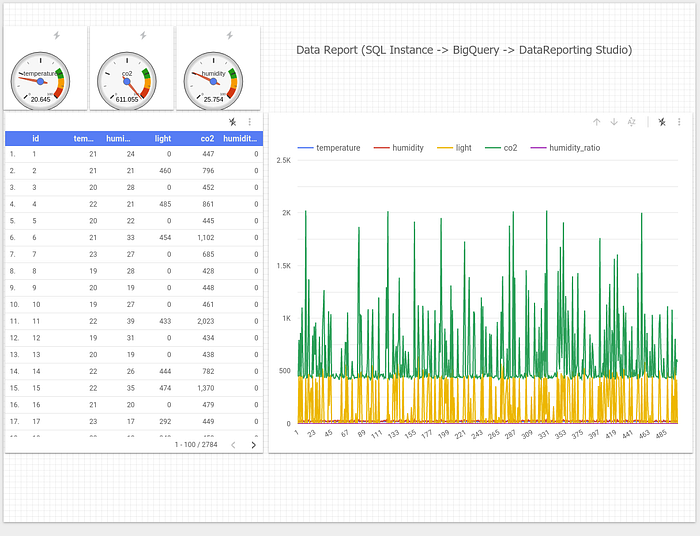
Click View:

When you finish polishing up your report you can share it. Again there are a few options to choose from, similarly to the standard Google Docs functionality:
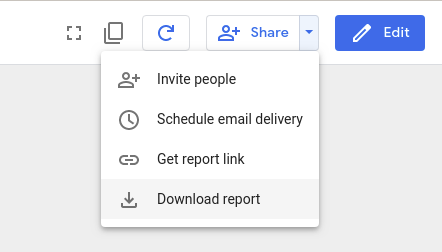
In this part of the GCP Goodies tutorial we went from building a simple web application which generates some data, processing that data in BigQuery up to analyzing it and creating report with Data Studio.
Flow like this could be an end-to-end process for some companies. This shows how powerful Google Computing Platform with its plethora of services could be. Having only a GCP console and less than an hour you can often create a full-blown solution — gathering, processing and visualizing your data.

