GCP Goodies Part 8— Stackdriver debugging

In this part of the series we are going to have a look into the last part of Stackdriver functionality which is Stackdriver Debugger. For this purpose we are going to build Play application in Scala and deploy it to our small and custom made Kubernetes cluster, so we can connect to it from Stackdriver debugger console.
Web application
As in all the parts of the GCP Goodies for Stackdriver we have created small Play application, written in Scala, which we will deploy to Google Kubernetes Engine cluster. The sources for the application can be found here
The important changes you need to do, to make the stackdriver debugger work for you, is, similarly to the profiler part, modifying the Dockerfile generation so the proper agent and JVM arguments are passed to the application.
To do that create the following docker entries with sbt:
The above code will generate for us the following entries in the Dockerfile:
Another modification is setting up the JVM parameters so the debugger agent will be enabled:
For the Dockerfile itself, one more modification is to change the entry point and pass name and version arguments which will be selectable on the Stackdriver Debugger web UI.
For the purposes of this tutorial, our web application contains simple smthToDebug endpoint which calls a service (ApiSampleService.scala) which in turn calls another class called DataGenerator. The whole idea is to create a flow in the application which you can observe using Stackdriver Debugger console. The endpoint, where accessed with GET request, simply returns a number of String UUIDs, as JSON, back to the user.
Cluster
Similarly to the previous parts of this series we are going to create a cluster, the only difference is that we need to provide a scope in which this cluster operates, as (from what I believe reading the docs) cloud_debugger is not enabled by default.
First, set some variables used along with this tutorial and authenticate with GCP:
NAME=stackdriver-test-8
ZONE=us-west2-a
gcloud auth login
gcloud config set compute/zone $ZONE
gcloud config set project softwaremill-playground-2
Of course change the values for the above commands to suit your needs.
Create the cluster with specific scope. Please note, that according to Google’s documentation you cannot change the access scopes of a cluster after creation. You can pick cloud_debbuger option (which will disable all other service access for your GKE), or the option for all Google Cloud APIs (cloud-platform).
gcloud container clusters create $NAME --num-nodes=2 --scopes=https://www.googleapis.com/auth/cloud-platform --enable-stackdriver-kubernetesI highly recommend setting up the cloud-platform scope instead of simply doing cloud_debugger as with cloud_debugger option you won’t be able to fetch docker images form the GCR (been there, done that).
Expose our server port to the world for easier testing:
kubectl expose deployment stackdriver-test8-debugger --type=LoadBalancer --port 80 --target-port 9000and get the external IP address with:
kubectl get servicesSo, all is good and you can access your service using the external IP address, now its time to play with the debugger itself.
Stackdriver debugger
If you have done everything correctly and your application is up and running, navigate to Stackdriver -> Debug on the GCP console. You should see that your application is already selected in the application drop down control. Now you need to pass the sources for your application somehow, to get the debugger going.
There is a plethora of options to choose from, starting from the simples local project and up to Github, Gitlab etc.
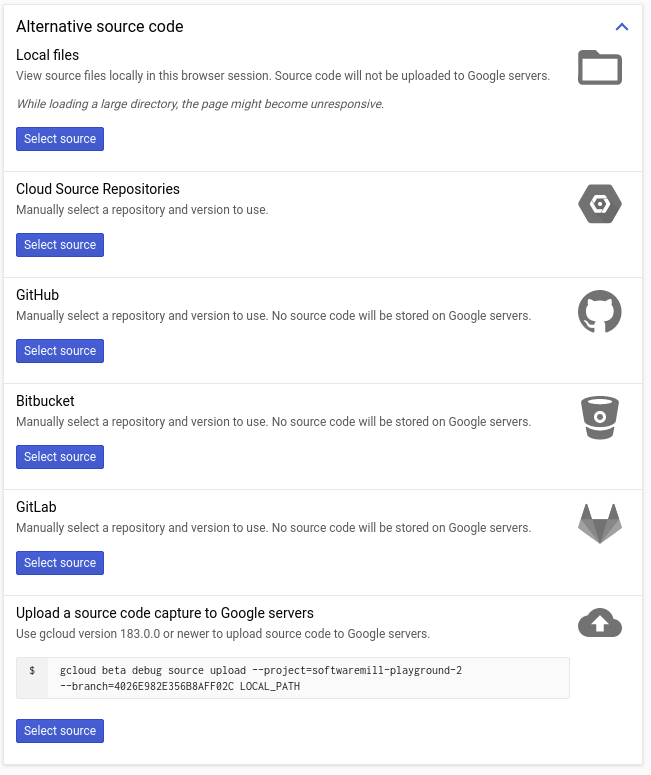
Of course Google provides its own source code repository solution called Cloud Source which we are not using here. If you want, you can fork the repository for GCP Goodies using your Github account and try this option or simply use Local files and point it to the directory on your local machine. From now on Stackdriver magic happens.
On the Stackdriver Debugger console you can create some break points and watch the call stack, as well as simply browse the current values for variables in scope.
The Stackdriver Debugger works a bit differently to the debuggers you could have used before (e.g in your IDE), as it’s not stopping the execution of the running program in production (of course). It will though, highlight the current break point and display the current snapshot of your application state.

Example call stack and variable values when break point has been hit:

On top of that, there is an ability to add in-place log points, which will be visible in Stackdriver Logging console as well as saving snapshots of your application state under the break point.
This is pretty cool ha!? With a few lines of code to modify your docker container and to add some JVM parameters, you can debug your production application in an accessible manner.
Watch this space for more GCP Goodies which I continuously discover and try to share with you on this blog series.